Introduction
This project, carried out by Dexuan Ren, focuses on the implementation of Optical Flow Estimation using the Lucas-Kanade method. The goal is to estimate the motion pattern between two consecutive frames or images.
Partial Codes

Methodology
Optical Flow Estimation
The Optical Flow Estimation was implemented using the following steps:
- Spatial Derivatives: A five-tap (central differences) derivative filter was used to compute spatial derivatives.
- Temporal Derivative: Gaussian filtering was applied to both images, and the first image was subtracted from the second.
- Eigenvalue Calculation: The flow estimate was considered valid only in regions where the 2×2 matrix was invertible, i.e., the smallest eigenvalue was greater than a threshold (e.g., τ = 0.01).
- Flow Visualization: The flow fields were visualized using the
flowToColorfunction.
Window Size Effect
Different window sizes were experimented with, and it was observed that as the window size grows, fewer optical flows are detected.
Image Warping
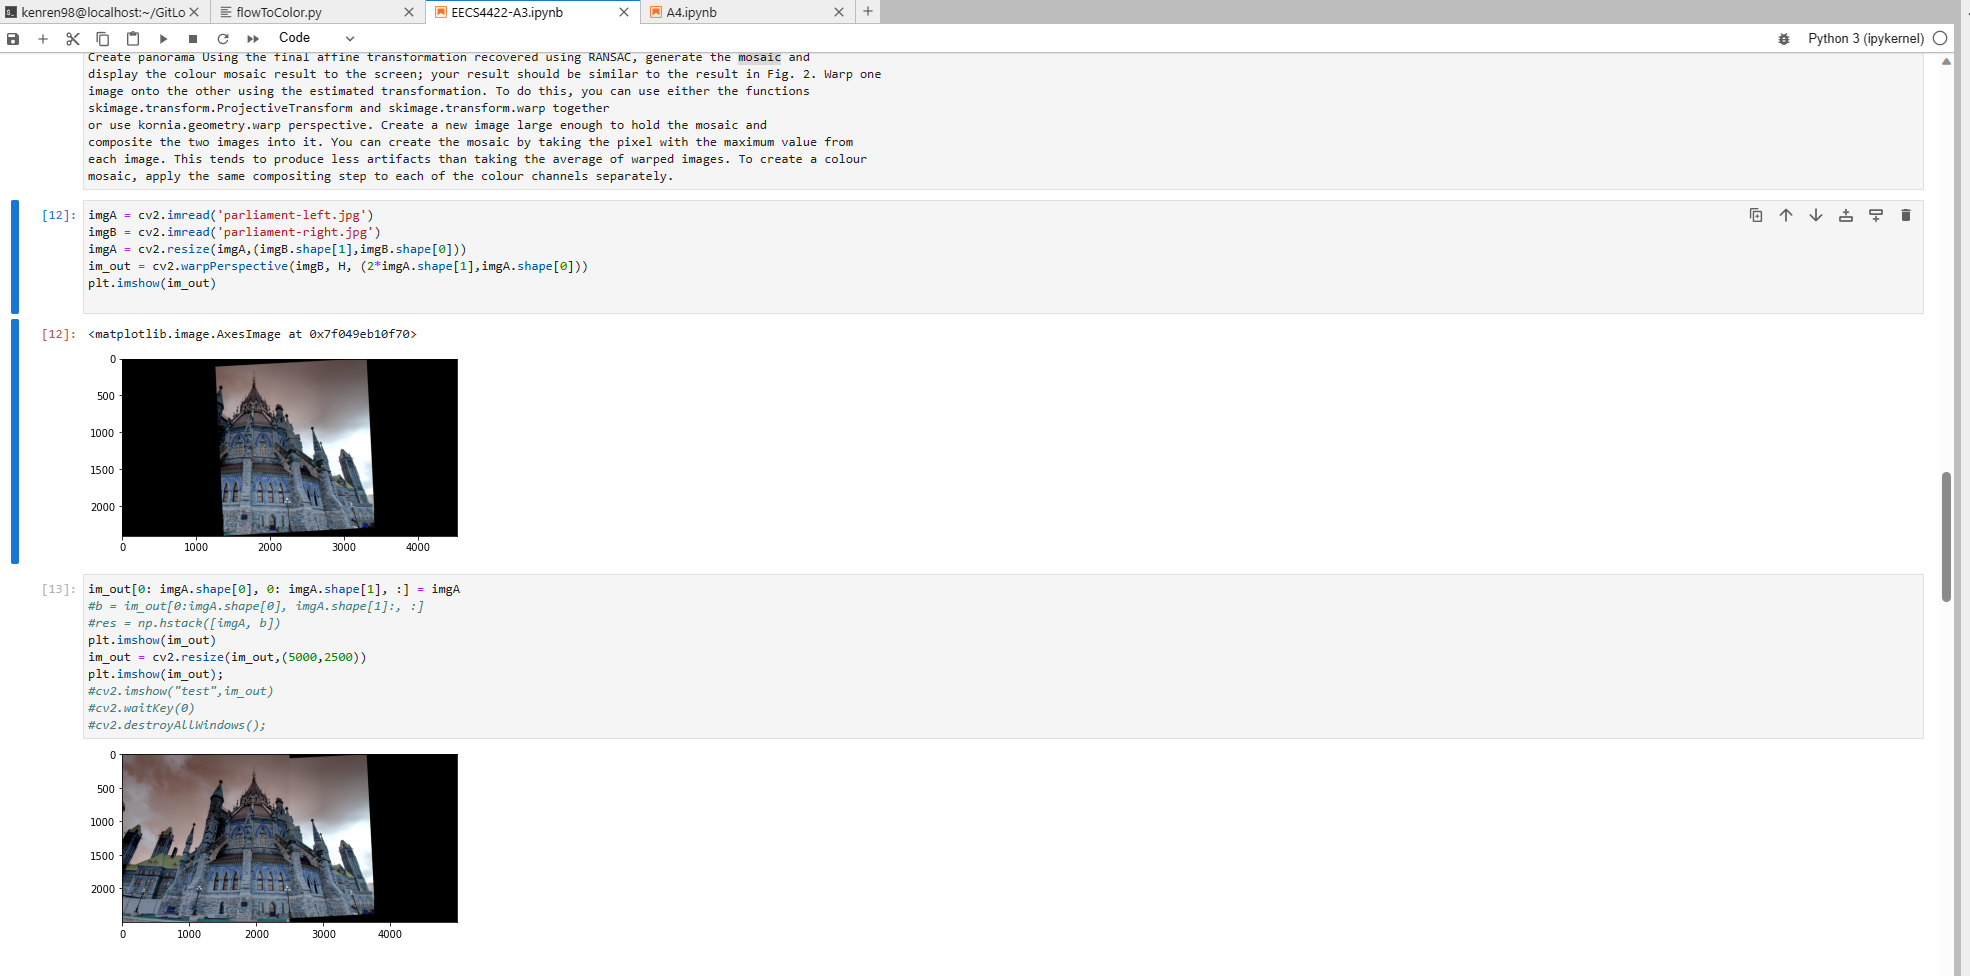
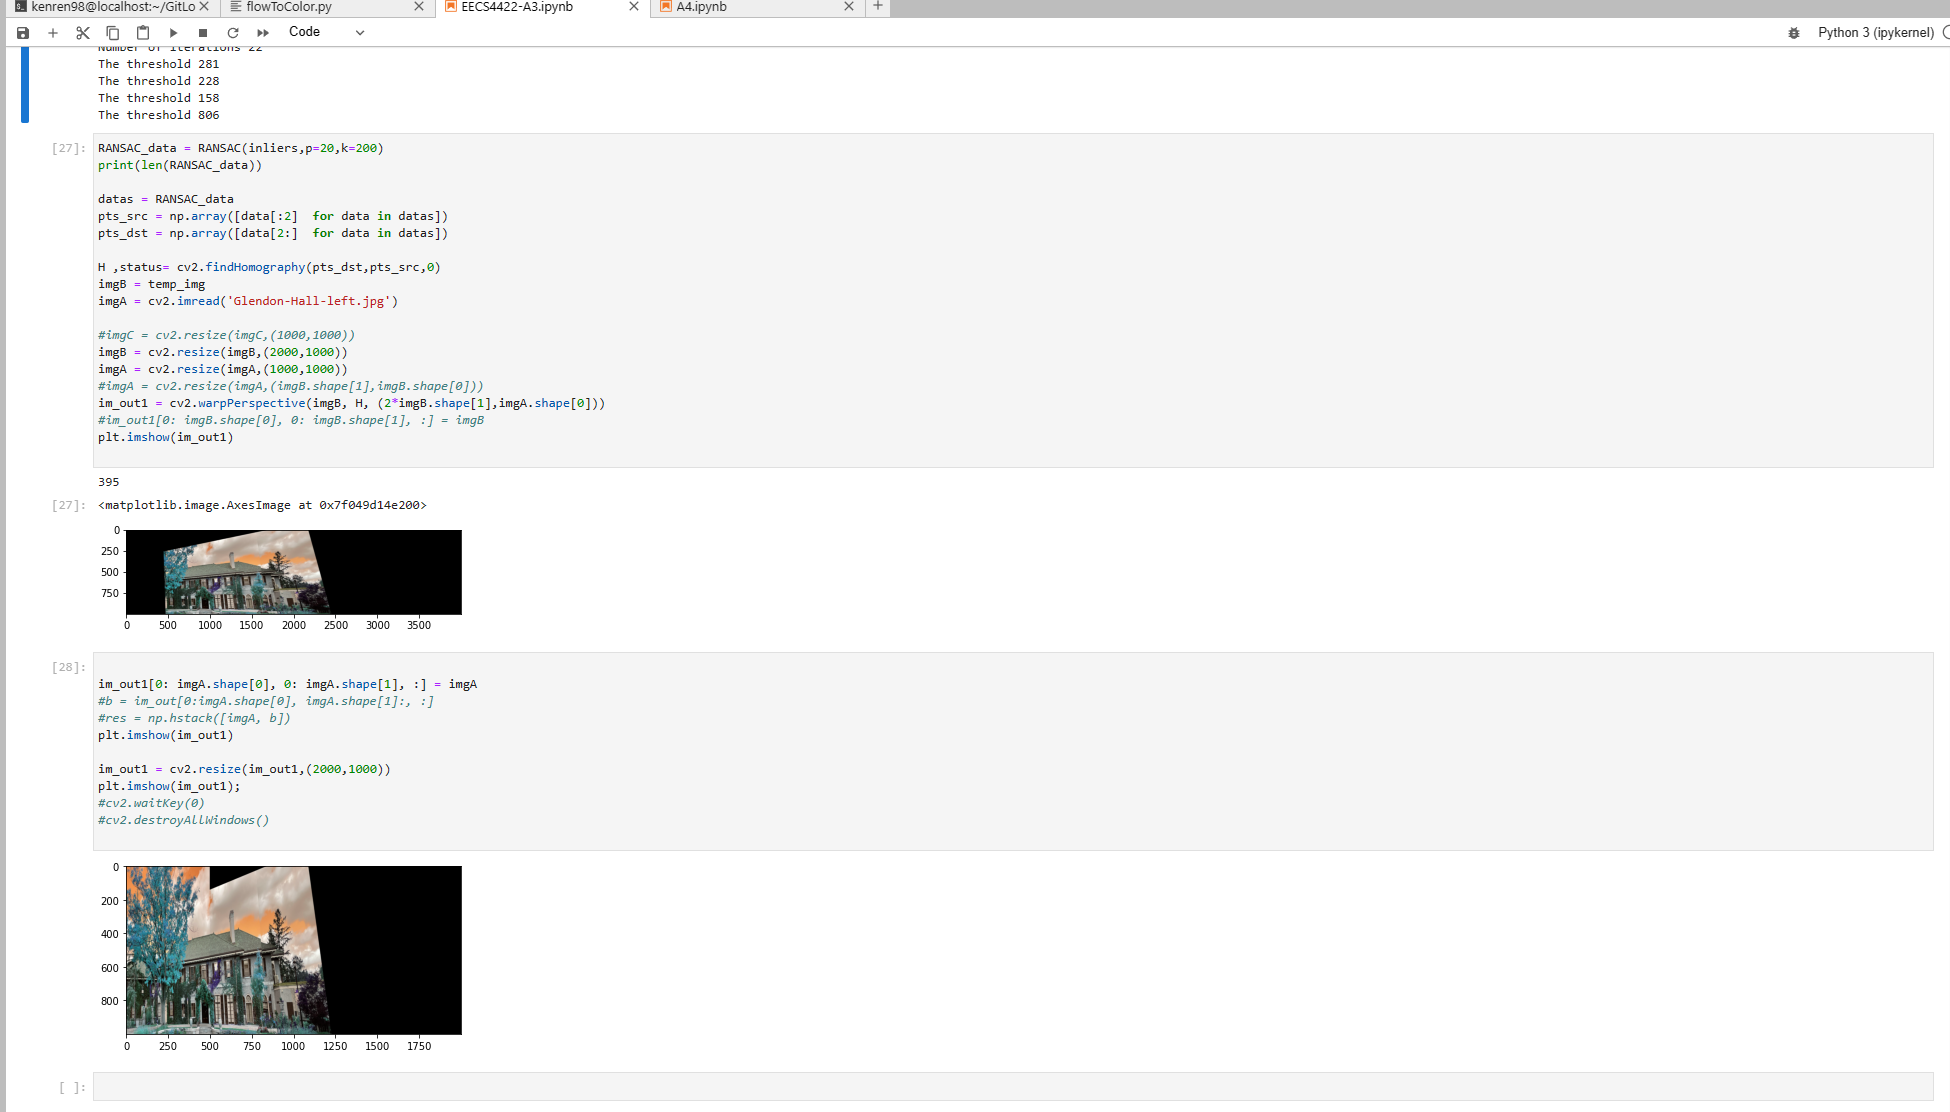
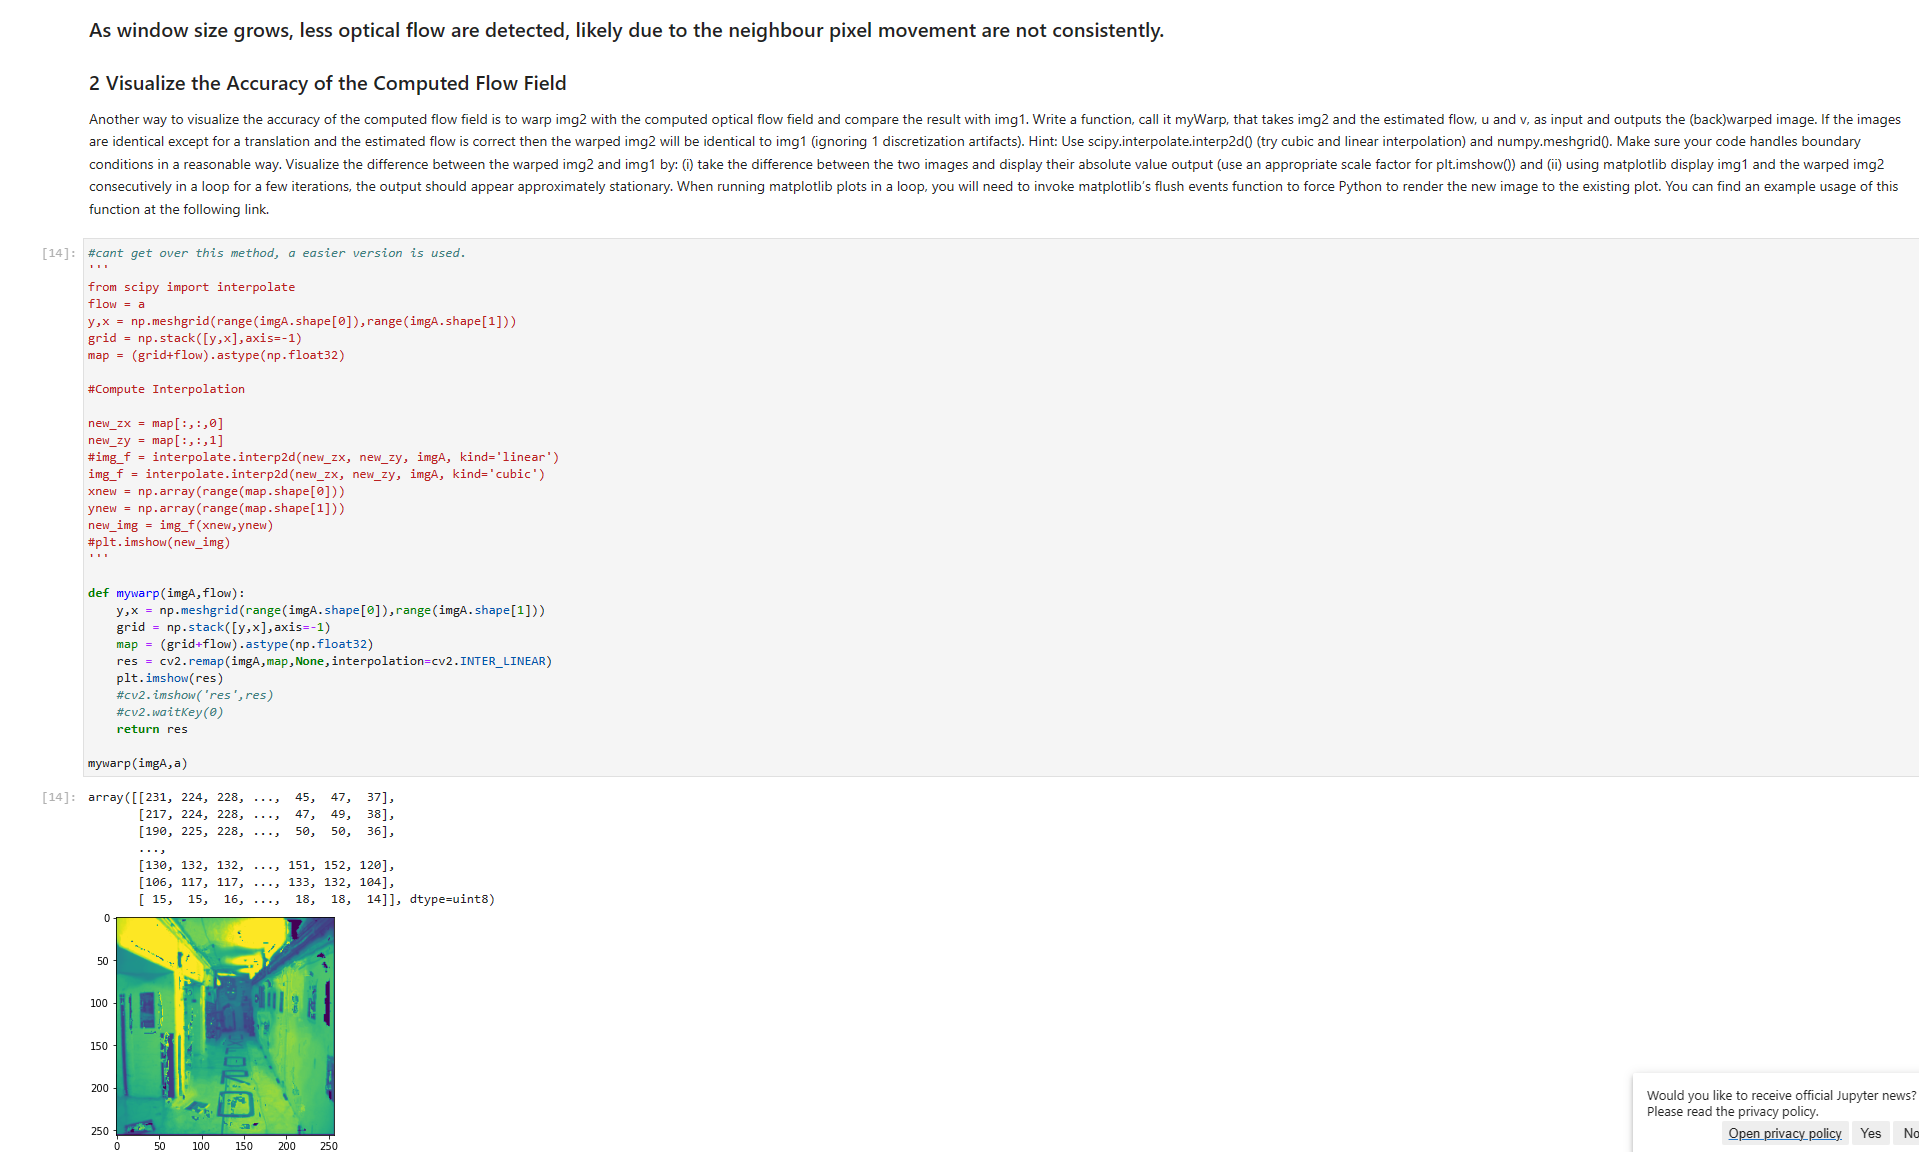
A function named myWarp was implemented to warp one image with the computed optical flow field and compare the result with the other image. This helped in visualizing the accuracy of the computed flow field.
Results
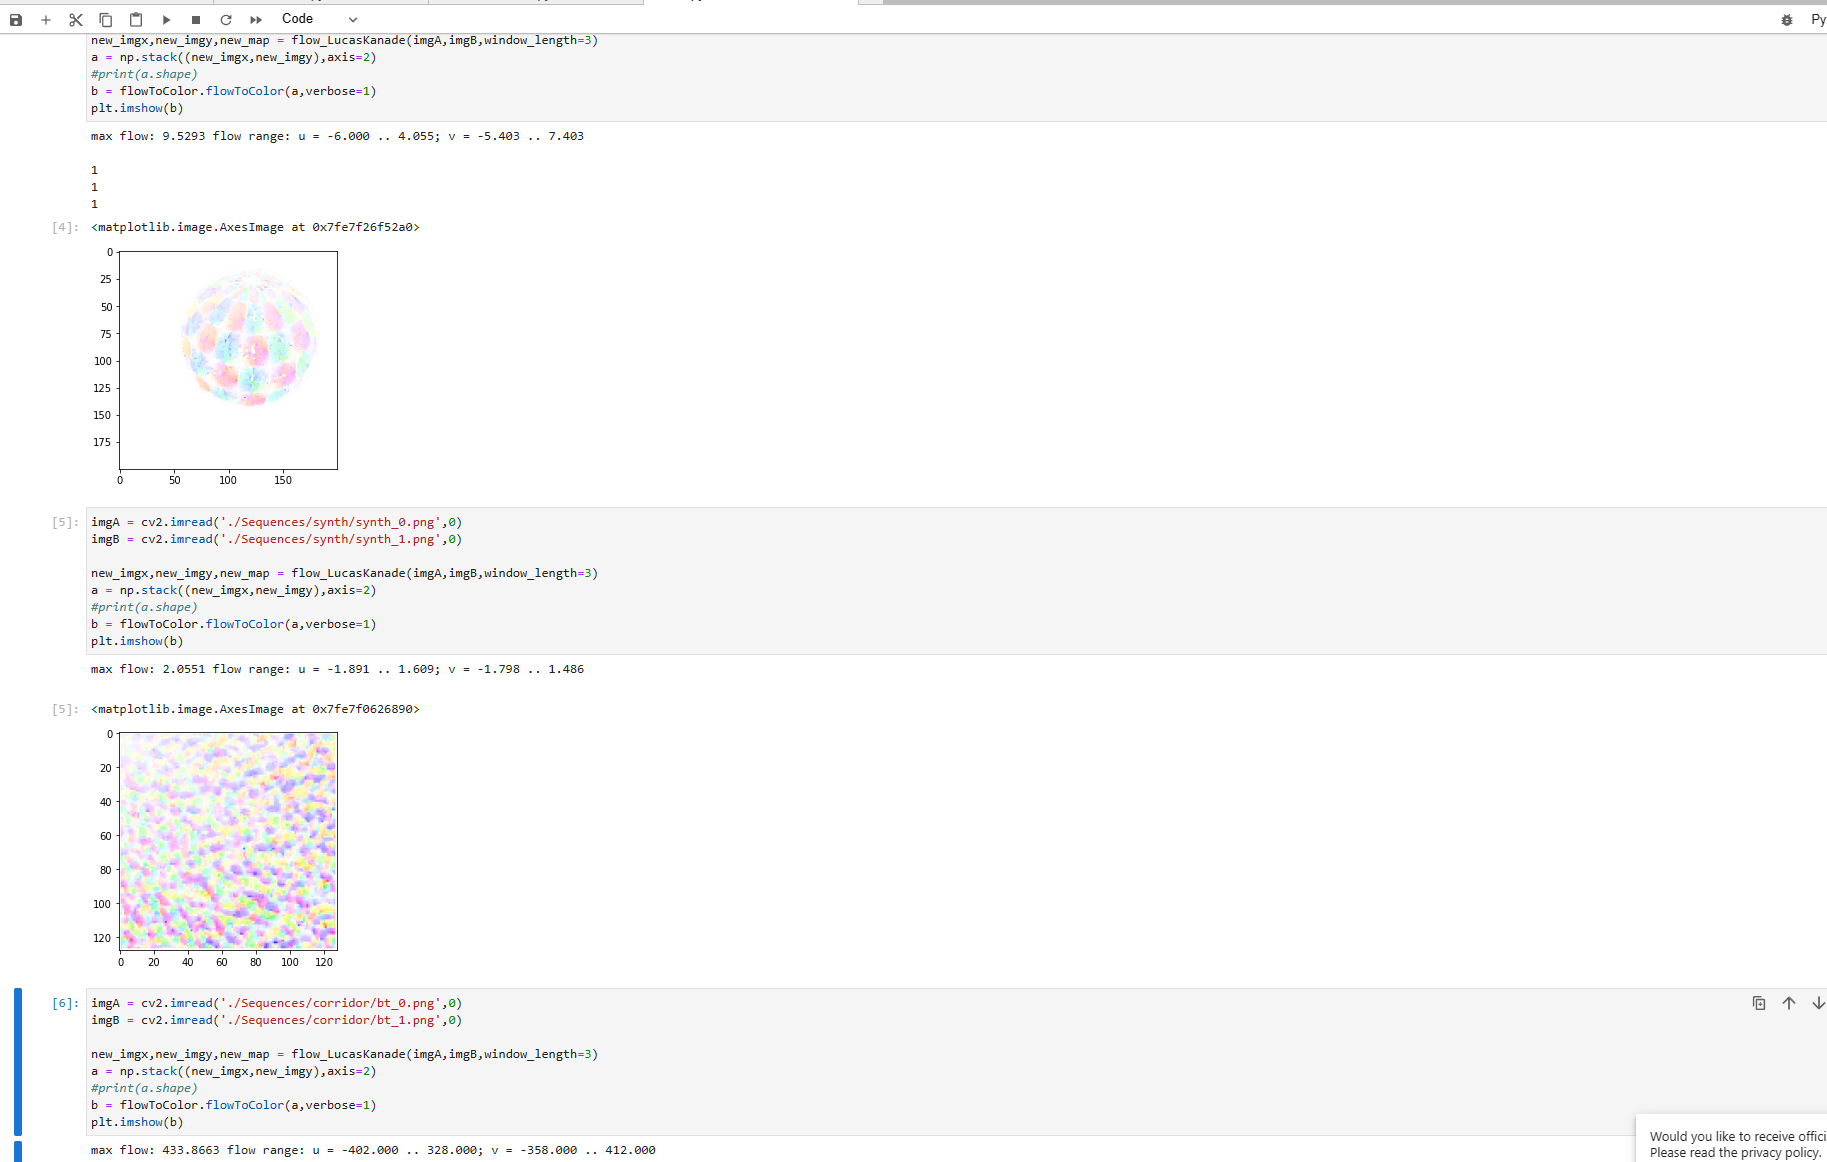
The Optical Flow Estimation was tested on various image sequences, including ‘sphere’, ‘synth’, and ‘corridor’. The results were visualized using matplotlib, and the flow range was computed for each case.
- Sphere Sequence: Max flow: 9.5293, Flow range: u = -6.000 .. 4.055; v = -5.403 .. 7.403
- Synth Sequence: Max flow: 2.0551, Flow range: u = -1.891 .. 1.609; v = -1.798 .. 1.486
- Corridor Sequence: Max flow: 433.8663, Flow range: u = -402.000 .. 328.000; v = -358.000 .. 412.000
Conclusion
The project successfully implemented Optical Flow Estimation using the Lucas-Kanade method. The effect of window size on the result was explored, and the accuracy of the computed flow field was visualized through image warping.